Time Series Analysis
- RICHA RAMBHIA
- Nov 30, 2022
- 3 min read

Updated: Sep 2, 2023
Time series analysis is a statistical method to analyze the past data within a given duration of time to forecast the future. (“Time Series Analysis”). And thus, we can say that the arrangement of data in accordance with the time of occurrence is said to be a time series which is the chronological arrangement of data.
Time series depicts the relationship between two variables where time is one of the variables and the second is any quantitative variable. Now, the most important use of time series is in predicting the future behavior of the variable based on the past experience which helps businesses in planning and comparing the actual current performance with the expected one.
Components for Time Series Analysis:
· Trend: It is a smooth, general, long-term, average tendency which shows the increase or decrease during a long period of time.
· Seasonal Variations: These are the rhythmic forces which would operate in a regular and periodic manner over a span of less than a year. (“Components of Time Series”).
· Cyclic Variations: The variations in a time series which would operate themselves over a span of more than one year are the cyclic variations. It is also called as Business Cycle.
· Random or Irregular movements: The other factor which would cause the variation in the variable under study are not regular variations being purely random or irregular.

(Pathak, P, 2021)
Time Series Forecasting:
When we associate a temporal or time component to the forecast, it then becomes the time series forecasting and the data is called as the time series data. (citation) It is the process of analyzing the time series data by using statistics and modeling to make predictions and informed decisions. Examples of the time series forecasting could be the weather forecast, forecasting the closing price of stock each day and so on.
The components are thus obtained when we decompose the time series and so there are two types of time series decomposition, namely, additive seasonal decomposition and multiplicative seasonal decomposition. Additive seasonal decomposition is when the individual components of the time series are at hand add up to get the original time series whereas the multiplicative seasonal decomposition is where the individual components need to be multiplied to get the time series data. Now, the reason to use any one of the types of decomposition over the other one is that the residue should not have any kind of pattern and it should be some random fluctuations.
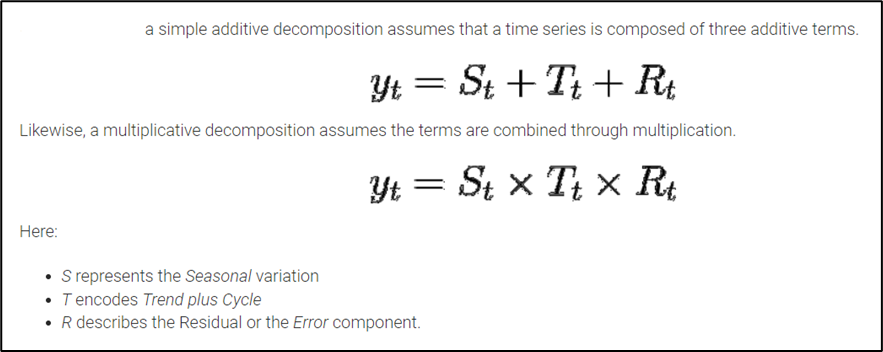
(“A VISUAL GUIDE TO TIME SERIES DECOMPOSITION ANALYSIS”)
Additive decomposition is the appropriate method if the magnitude of seasonal fluctuations or variations does not vary with the level of time series whereas multiplicative decomposition method is used when the variation in the seasonal pattern or the variation around the cycle appears to be proportional to the level of time series. (“Additive vs Multiplicative model in Time Series Data”).
As a business application, let’s consider an example of how the decomposition method play out in the real world. The example of decomposing the time series data of the number of flights per month on a passenger airline over 10 years. Here, let’s assume that the business of the airlines is growing over time because the population is growing and so if the population growth is in a linear regime, then the trend line of the time series data will be linear as well. Now, this is because the seasonal variation is thought of as the ratios of passengers who are willing to travel in a given time period which is in the given month compared with the ones who are travelling in the month of January rather than an additive factor. Whereas examples of instances where a multiplicative decomposition would be appropriate include the earnings of growing company as time passes.
Real world example with respect to the retail sales often uses the time series analysis to see how the total sales is trending over time and the time series graph of which is as shown below. This would help the retail stores in order to accurately predict the sales will be during the upcoming period of time.
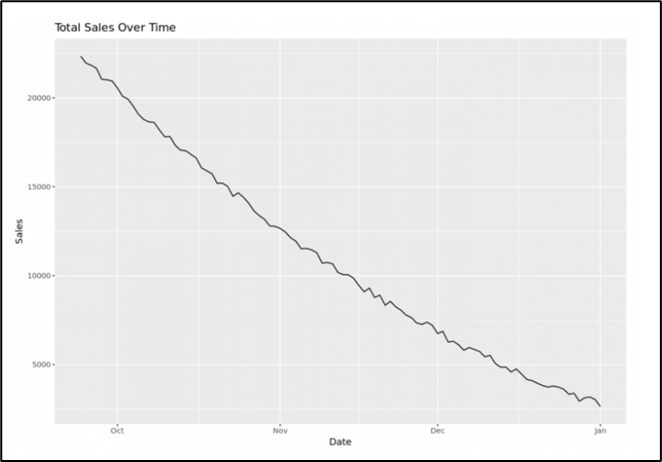
(Zach, S, 2021).
References:
Time Series Analysis. (n.d.). Educba, from https://www.educba.com/time-series-analysis/
Components of Time Series. (n.d.). Toppr, from https://www.toppr.com/guides/business-mathematics-and-statistics/time-series-analysis/components-of-time-series/
Pathak, P. (2021, September 8). Time Series Forecasting — A Complete Guide. Analytics Vidhya, from https://medium.com/analytics-vidhya/time-series-forecasting-a-complete-guide-d963142da33f
A VISUAL GUIDE TO TIME SERIES DECOMPOSITION ANALYSIS. (2019b, August 2). Daitan, from https://www.daitan.com/innovation/a-visual-guide-to-time-series-decomposition-analysis-a1472bb9c930/
Additive vs Multiplicative model in Time Series Data. (n.d.). StackExchange, from https://datascience.stackexchange.com/questions/46050/additive-vs-multiplicative-model-in-time-series-data#:~:text=The%20additive%20decomposition%20is%20the%20most%20appropriate%20if,vary%20with%20the%20level%20of%20the%20time%20series.
Browniee, J. (2017, January 30). How to Decompose Time Series Data into Trend and Seasonality. Machine Learning Mastery, from https://machinelearningmastery.com/decompose-time-series-data-trend-seasonality/
Zach, S. (2021g, August 5). 5 Examples of Time Series Analysis in Real Life. Statology, from https://www.statology.org/time-series-analysis-real-life-examples/


Comments